RevivCart – E-Commerce Marketplace Revenue & Operations Analysis
Published in Data Analytics Project, 2026
Context
Conducted an end-to-end analytics project on RevivCart, a simulated B2C e-commerce marketplace operating across Electronics, Fashion, and Home & Living categories. The platform was experiencing margin pressure despite 12% YoY revenue growth, prompting a full diagnostic across revenue performance, customer retention, category health, and operational efficiency.
Dataset: Olist Brazilian E-Commerce Public Dataset (Kaggle) — 100K+ real orders across 8 relational tables.
Problem
Despite consistent GMV growth, profitability was declining. Leadership suspected three root causes: high cancellation rates in specific categories, over-reliance on discounts eroding AOV, and poor delivery performance driving customer churn. The analysis was scoped to answer seven targeted business questions across Commercial, Category Management, and Operations stakeholder groups.
Actions
Data Preparation
- Audited 8 raw CSV tables for NULL patterns, orphan records, and data type inconsistencies before analysis
- Built an automated Python pipeline (pandas, SQLAlchemy) to clean, transform, and load 7 normalized tables into PostgreSQL
- Designed a star schema data model (1 fact table, 4 dimension tables) following data warehousing best practices
SQL Analysis — 7 Targeted Business Queries
- Calculated monthly GMV and AOV trends using date aggregation and status filtering to identify seasonality patterns
- Ranked top 10 revenue-generating categories with average review scores using multi-table JOINs and LEFT JOIN for optional review data
- Measured cancellation rate by category using conditional aggregation (
CASE WHEN) andHAVINGto filter statistically significant groups - Segmented customer purchase frequency using subqueries to quantify repeat purchase rate and retention opportunity
- Correlated delivery delay buckets with review scores using
CASEsegmentation and date arithmetic - Identified top 3 sellers per category using
RANK() OVER (PARTITION BY category)window function - Analyzed payment method mix and AOV differential using single-table aggregation and
SUM() OVER()window function
Power BI Dashboard — 3 Report Pages
- Built star schema model in Power BI with custom Date Table and 7 DAX measures including dynamic cancellation rate and cross-table review score calculations using
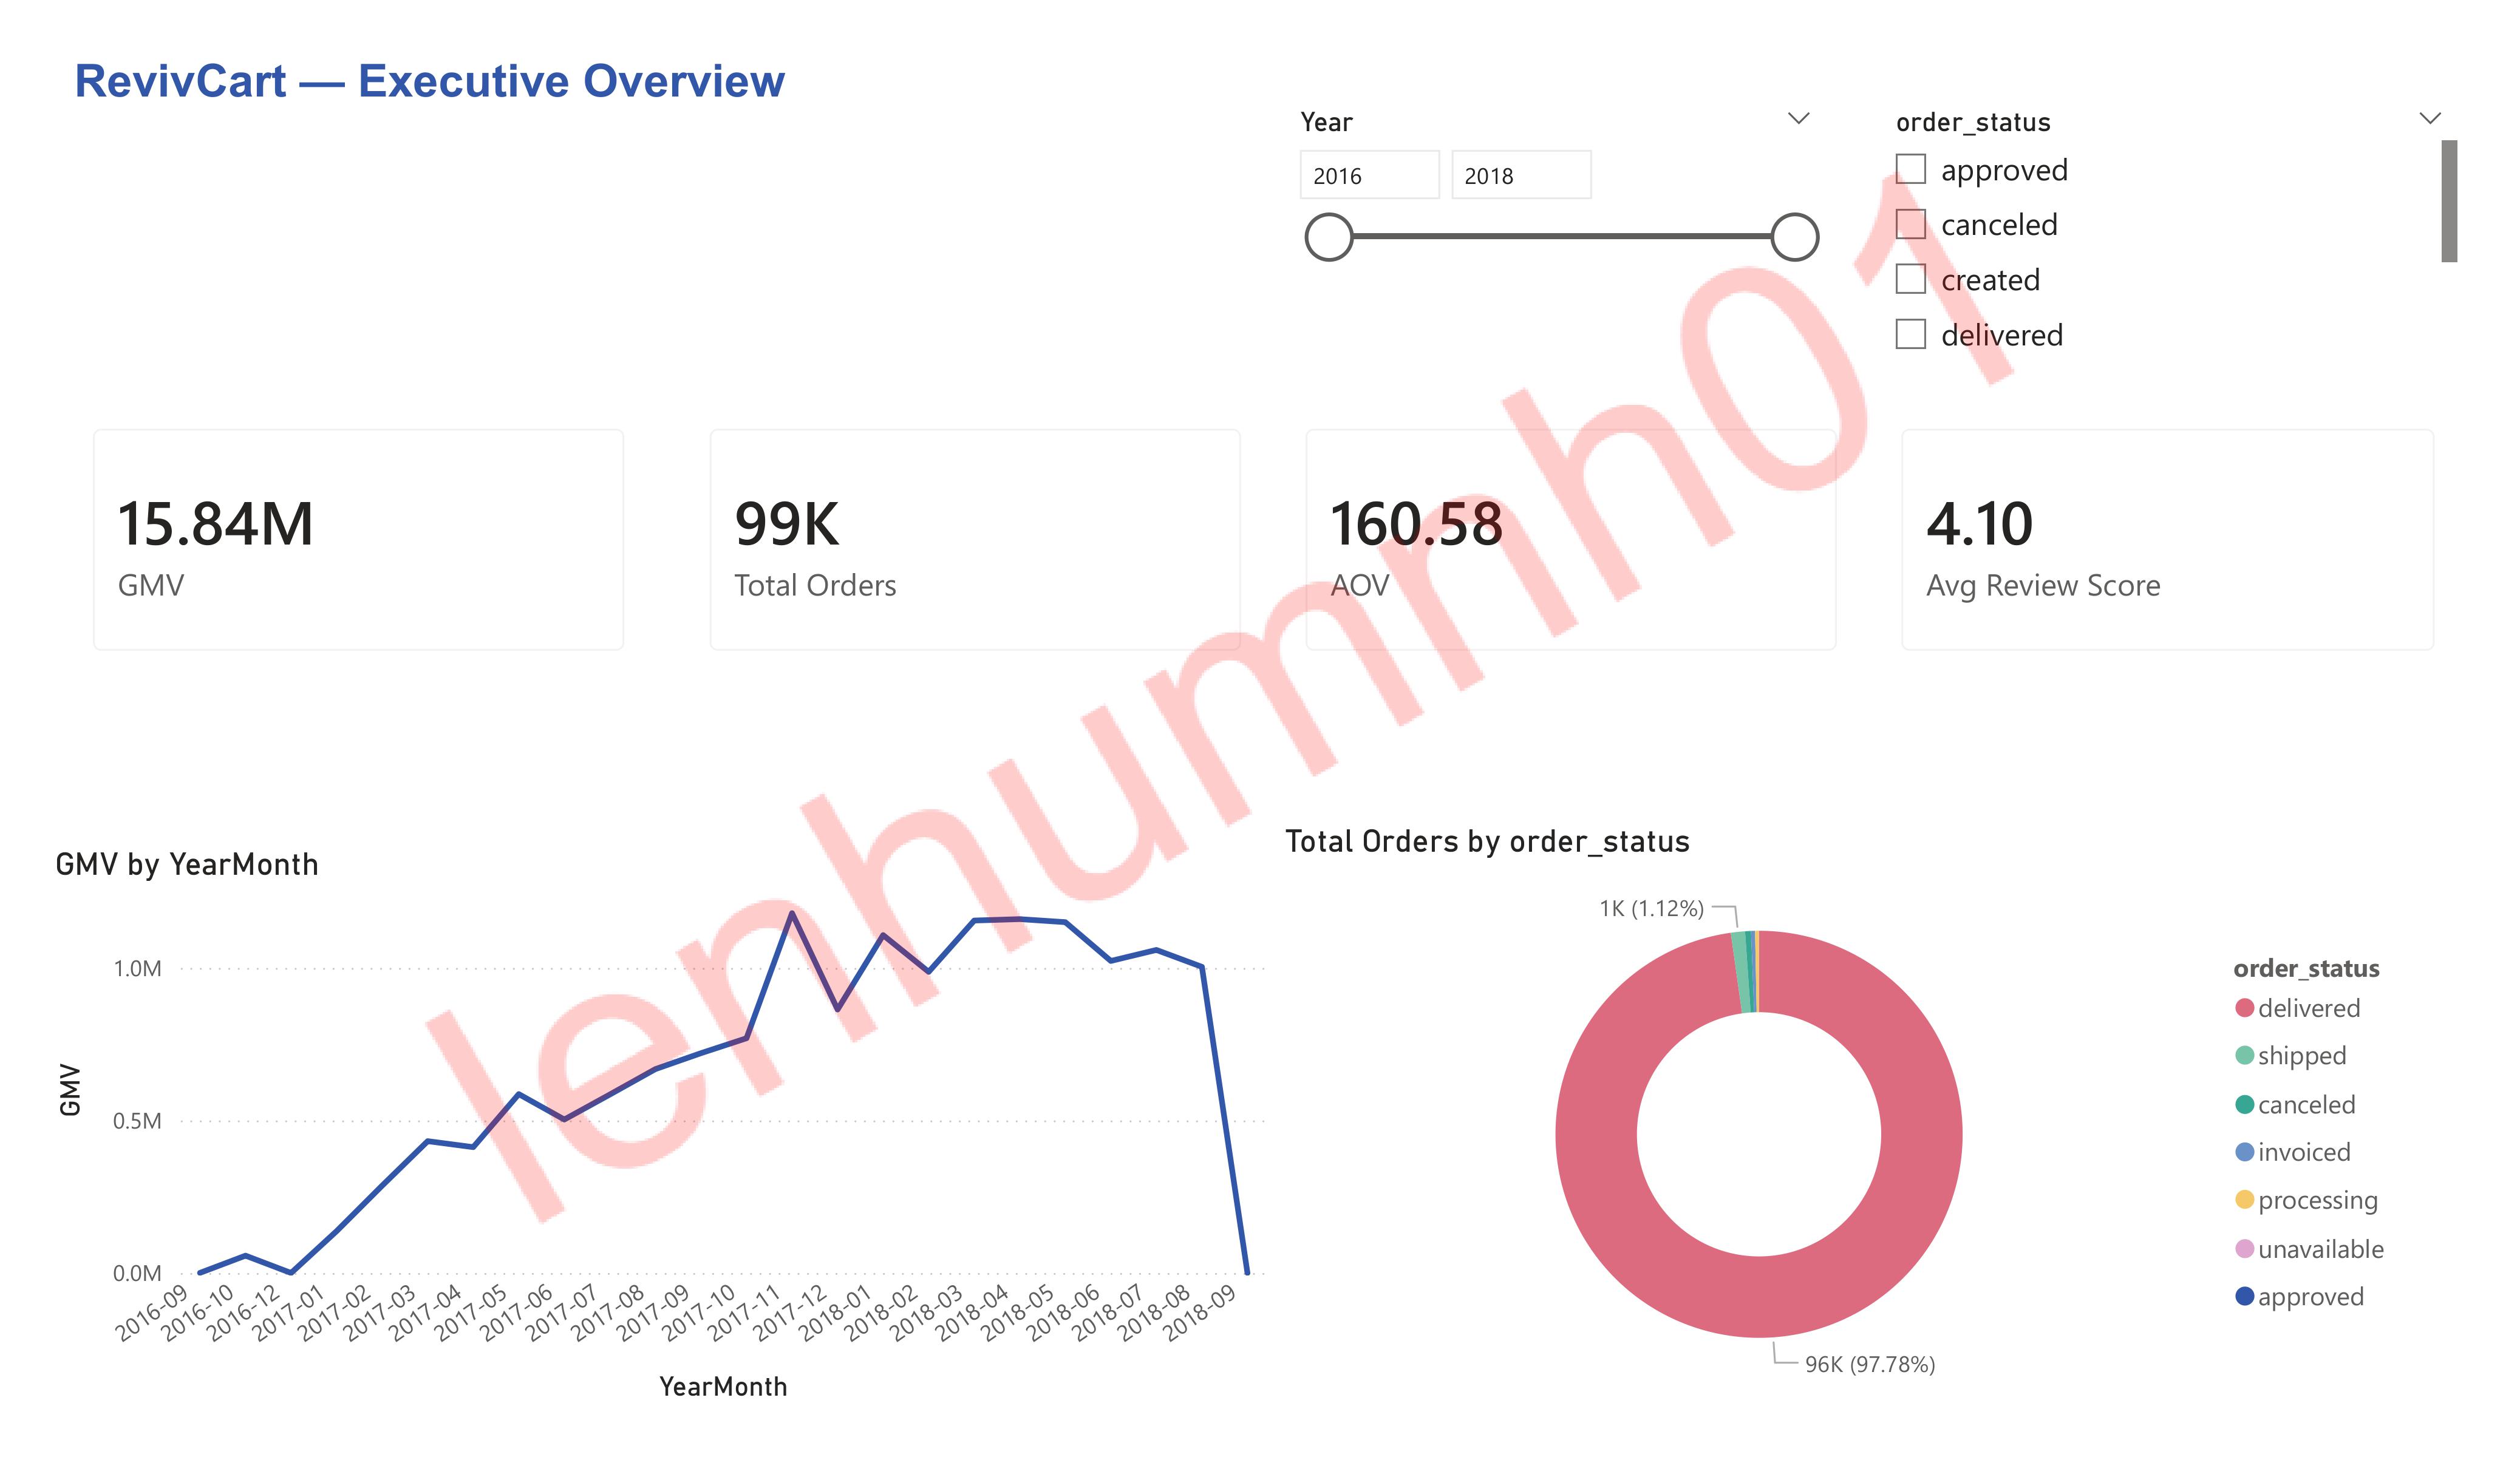
RELATEDTABLE - Delivered Executive Overview page: GMV trend line chart, 4 KPI cards, order status donut chart, and synced year/status slicers
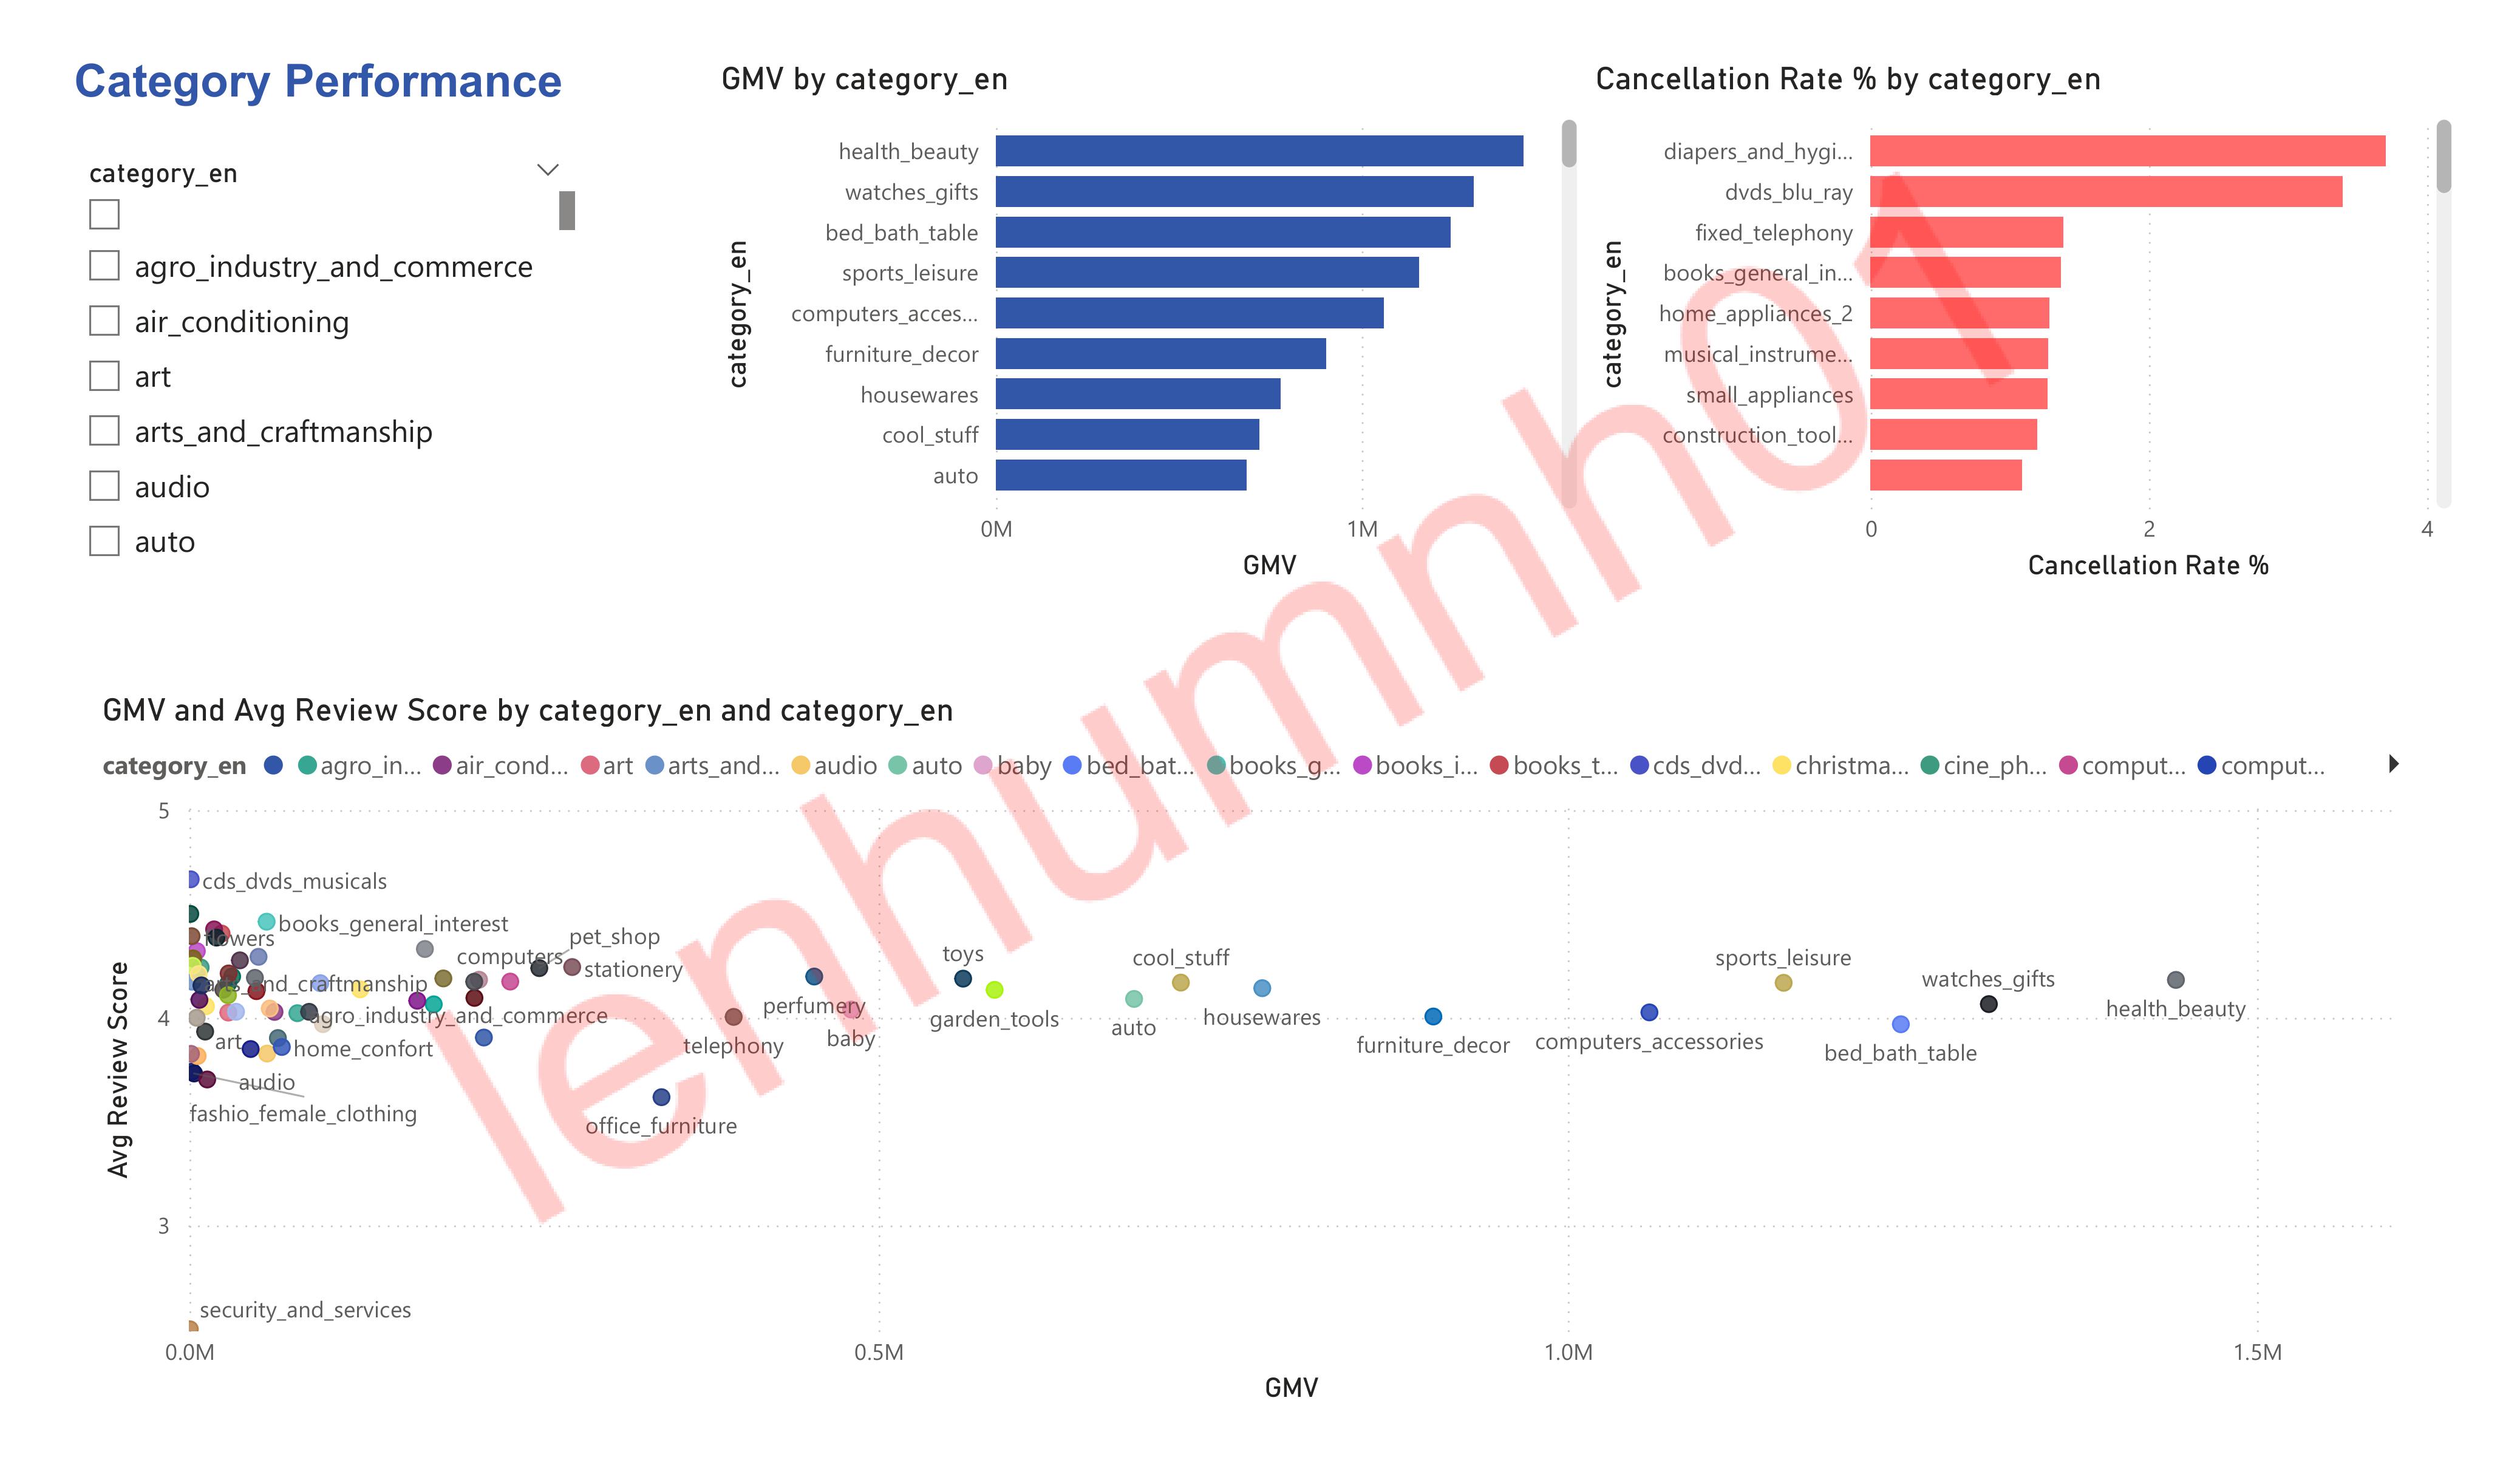
- Delivered Category Performance page: revenue ranking, cancellation rate comparison, and scatter plot quadrant analysis (Star/Hidden Gem/At Risk/Problem)
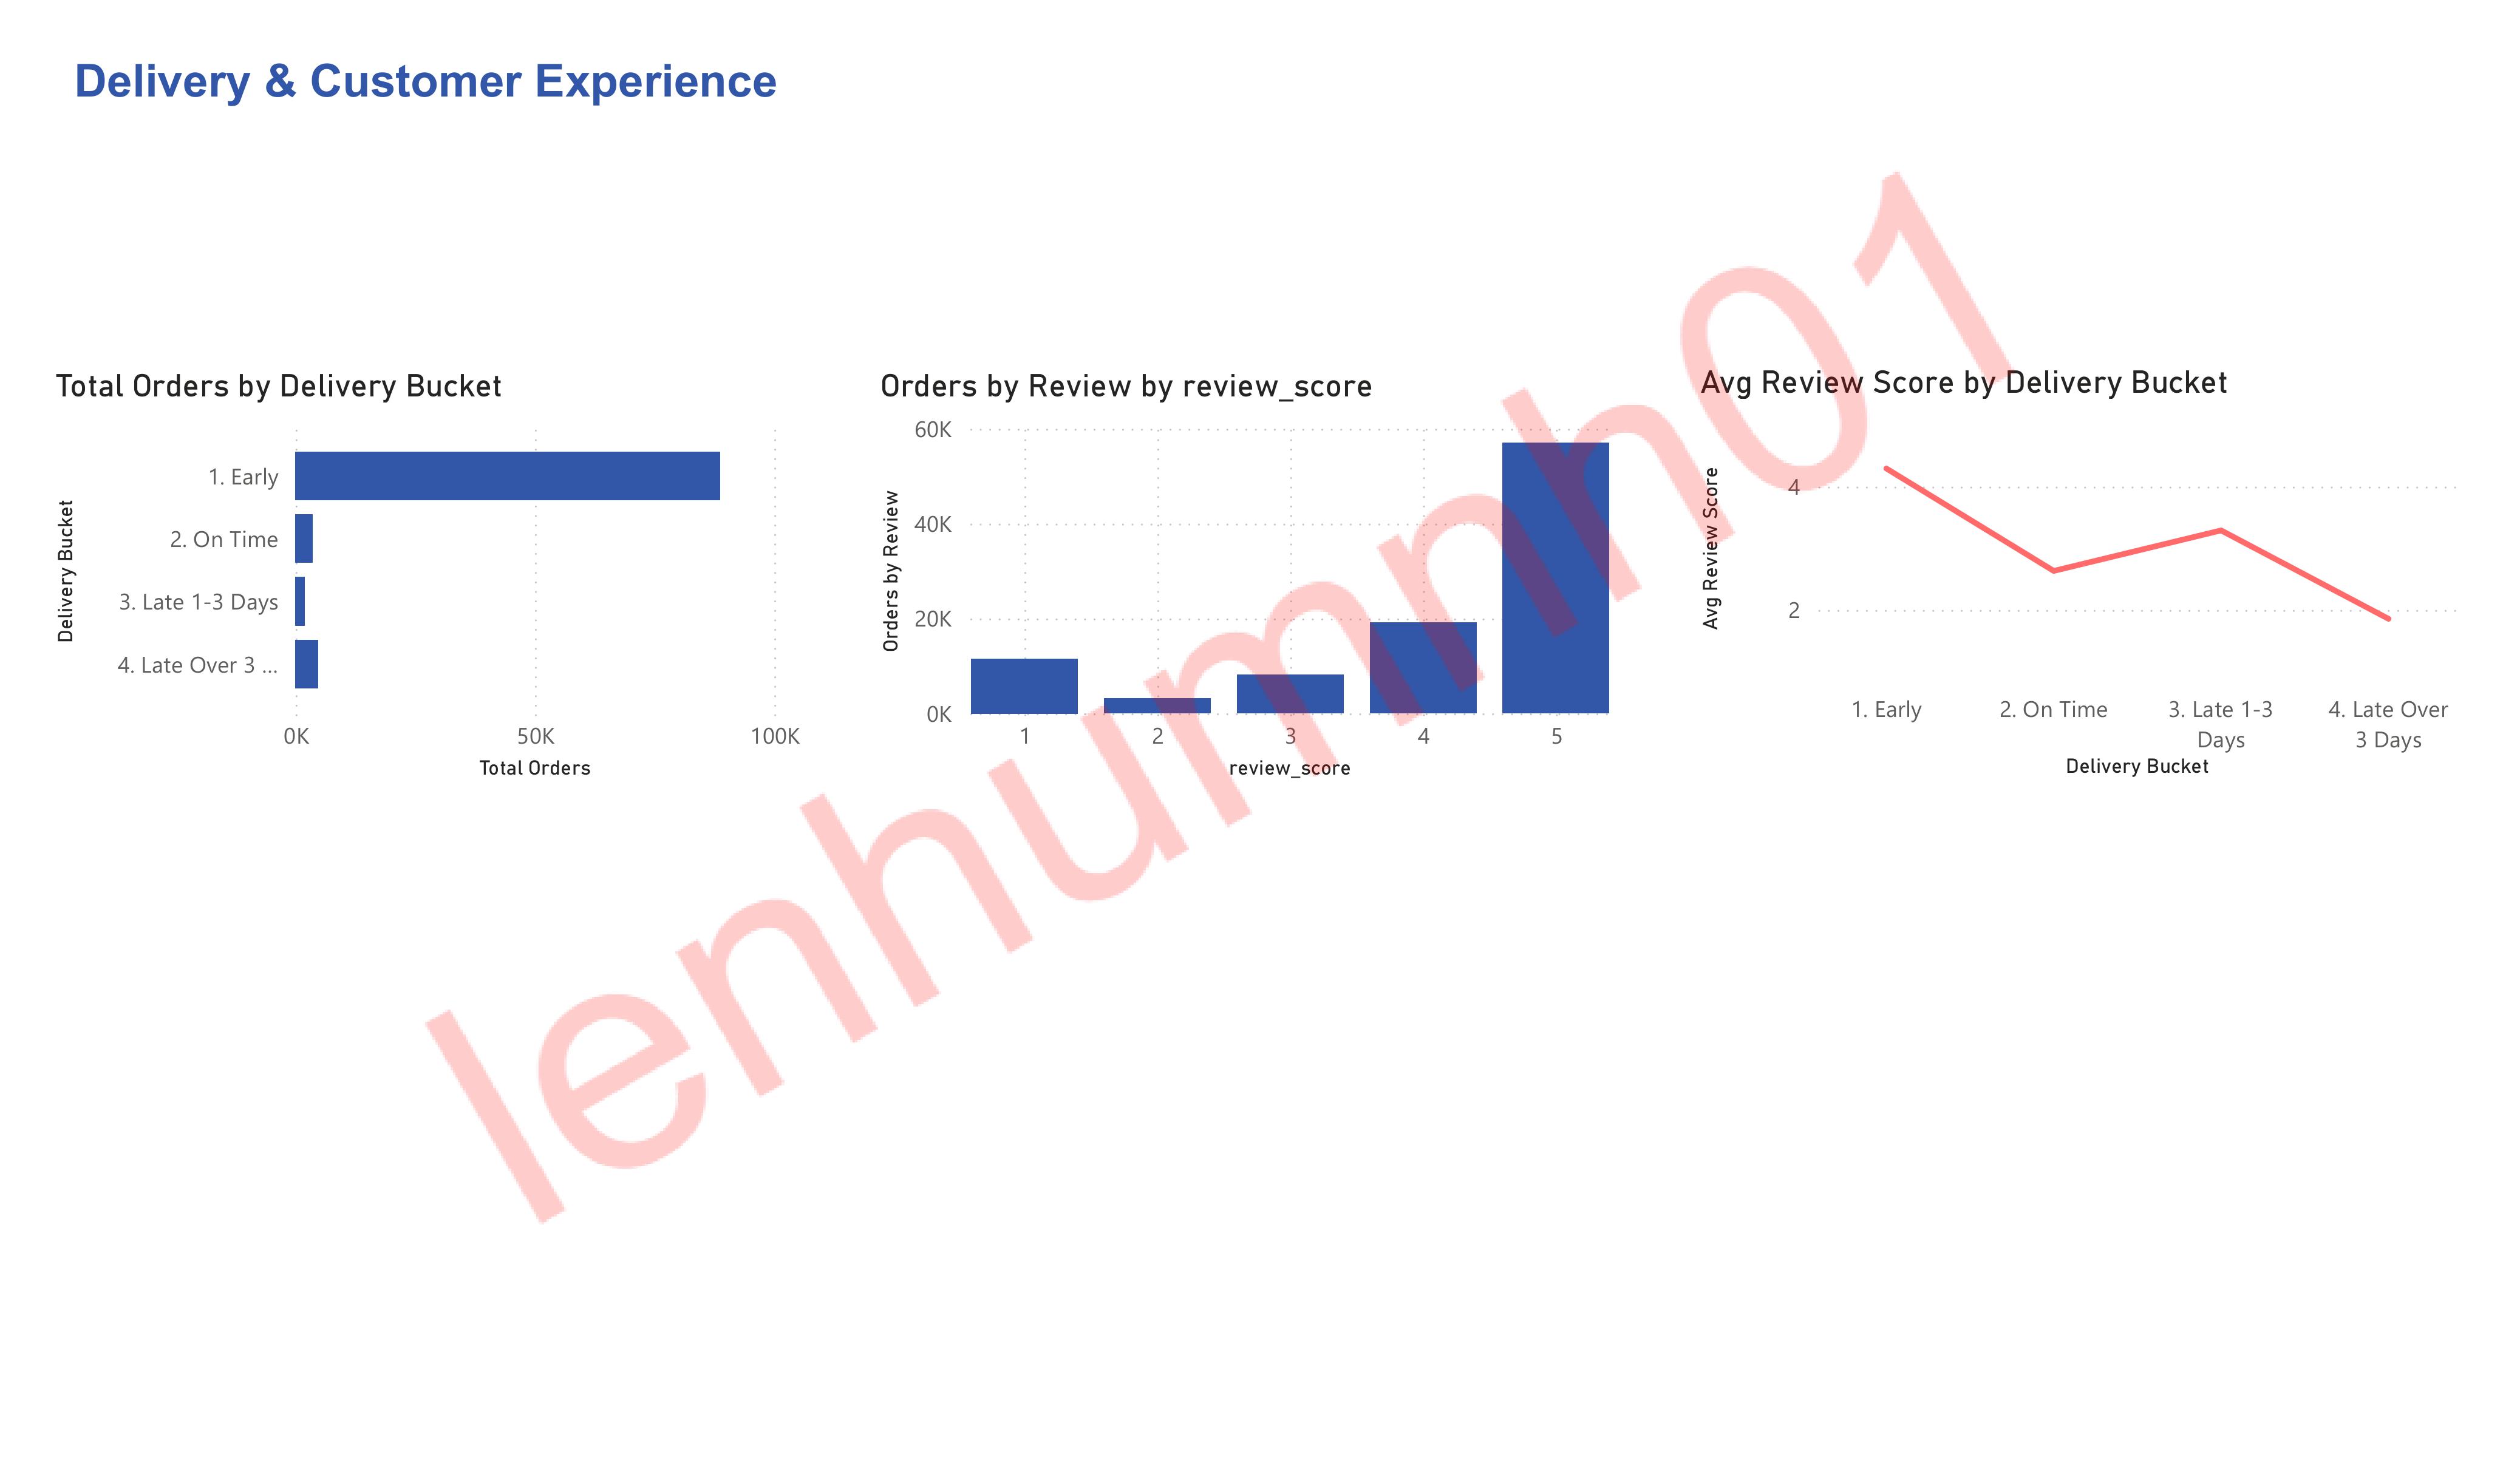
- Delivered Delivery & Experience page: delivery bucket distribution, review score histogram, and delay-to-review correlation line chart
Outcome
- Identified that 97% of 93K customers are one-time buyers — quantified retention opportunity at ~R$300K incremental GMV from a 2% improvement in repeat purchase rate
- Diagnosed delivery delays exceeding 3 days as the primary driver of poor customer satisfaction, with affected orders scoring 1.86★ vs 4.29★ for early deliveries — a 2.43-point drop
- Surfaced seller concentration risk in the computers category where the top seller accounts for 83% of category revenue, representing a critical single point of failure
- Revealed voucher inefficiency: voucher AOV (R$66) is 60% below credit card AOV (R$163) due to absence of minimum order value enforcement
- Segmented categories into four strategic quadrants, identifying health_beauty as the highest-ROI investment opportunity and office_furniture as an at-risk category requiring seller quality intervention
Key Insights
| # | Insight | Recommended Action |
|---|---|---|
| 1 | 97% one-time buyers → R$300K retention opportunity | Launch post-purchase loyalty program |
| 2 | health_beauty: highest GMV + highest review score | Increase marketing budget allocation |
| 3 | Delivery delays 3+ days → review score drops 2.43 points | Enforce hard SLA with auto-compensation |
| 4 | Top seller = 83% of computers category revenue | Diversify seller pool to reduce concentration risk |
| 5 | Voucher AOV 60% lower than credit card | Set R$100 minimum order value for voucher redemption |
| 6 | office_furniture: high GMV but lowest review score in top 10 | Audit seller quality before scaling |
Skills Demonstrated
| Category | Skills |
|---|---|
| SQL | Multi-table JOIN, LEFT JOIN, GROUP BY, HAVING, conditional aggregation, subquery, window functions (RANK, SUM OVER) |
| Python | pandas, SQLAlchemy, os.path, data type conversion, ETL pipeline |
| Power BI | Star schema modeling, DAX measures, RELATEDTABLE, Date Table, cross-page slicers |
| Analytics | KPI definition, data auditing, cohort thinking, business impact quantification |
| Domain | E-commerce KPIs (GMV, AOV, cancellation rate, NPS proxy), marketplace dynamics |
Dashboard Preview